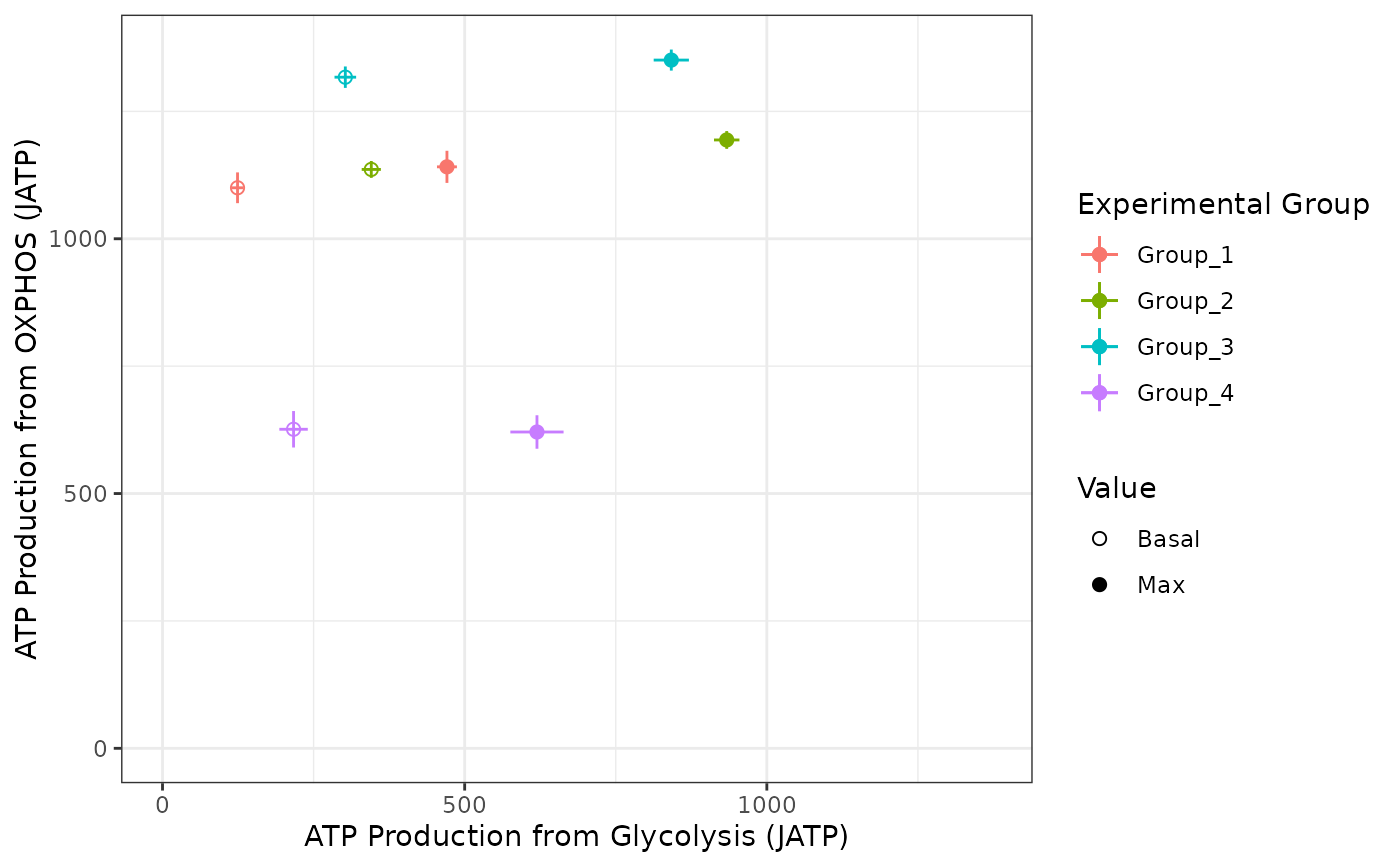
Wrapper to create a 2D plot visualizing the mean and standard deviation basal and maximal ATP production from glycolysis and OXPHOS for each experimental group Create a Bioenergetic scope plot from input Seahorse Wave export, long-form rates excel files
Arguments
- rep_list
A list of Seahorse Wave excel export files. One file per replicate. Group all replicates for a given experiment in a single folder, and write that folder's path in "seahorse_data". You can use `list.files("seahorse_data") "full.names=TRUE") to get the paths to the files.
- ph
pH value for energetics calculation (for XF Media, 7.5)
- pka
pKa value for energetics calculation (for XF Media, 6.063)
- buffer
buffer for energetics calculation (for XF Media, 0.1 mpH/pmol H+)
- sheet
The number of the excel sheet containing the long-form Seahorse data. Default is 2 because the long-form output from Seahorse Wave is on sheet 2
Examples
rep_list <- system.file("extdata", package = "ceas") |>
  list.files(pattern = "*.xlsx", full.names = TRUE)
make_bioscope_plot(rep_list, ph = 7.4, pka = 6.093, buffer = 0.1)
#> Warning: Replicates were combined within groups, but future releases of ceas will calculate energetics without combining them - use `sep_reps = FALSE` to maintain replicate combination.

